
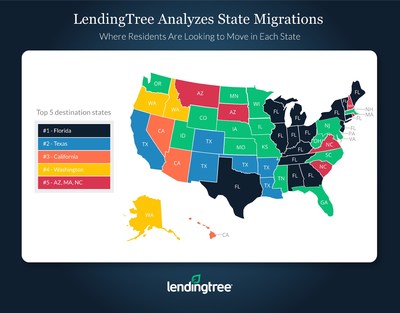
LendingTree's State Migration Study Finds Americans Are Moving South
Key findings
Most people looking to move out of state don't want to go far. More than half of the most popular new destination states border the current state. But if they are looking to move cross-country, chances are it's to
To view the full report, visit https://www.lendingtree.com/home/mortgage/study-finds-americans-moving-south/.
|
State |
Percentage |
Top new |
Percentage |
|
AK |
24.80% |
WA |
10.80% |
|
AL |
9.30% |
FL |
22.40% |
|
AR |
9.30% |
TX |
17.10% |
|
AZ |
11.20% |
CA |
11.30% |
|
CA |
14.10% |
TX |
11.20% |
|
CO |
15.00% |
TX |
11.60% |
|
CT |
17.30% |
FL |
23.90% |
|
DE |
17.90% |
PA |
23.60% |
|
FL |
8.90% |
GA |
13.80% |
|
GA |
9.20% |
FL |
26.50% |
|
HI |
22.40% |
CA |
12.80% |
|
IA |
12.20% |
IL |
10.10% |
|
ID |
12.30% |
WA |
20.70% |
|
IL |
14.20% |
FL |
14.20% |
|
IN |
10.00% |
FL |
18.80% |
|
KS |
15.50% |
MO |
31.20% |
|
KY |
10.50% |
FL |
15.40% |
|
LA |
9.90% |
TX |
25.60% |
|
MA |
17.90% |
NH |
21.50% |
|
MD |
17.20% |
VA |
13.50% |
|
ME |
11.30% |
FL |
21.00% |
|
MI |
8.60% |
FL |
22.00% |
|
MN |
12.00% |
WI |
15.40% |
|
MO |
10.80% |
KS |
14.40% |
|
MS |
10.40% |
TN |
16.70% |
|
MT |
13.80% |
AZ |
11.10% |
|
NC |
9.80% |
SC |
28.10% |
|
ND |
21.60% |
MN |
29.90% |
|
NE |
12.30% |
IA |
15.10% |
|
NH |
17.80% |
MA |
18.60% |
|
NJ |
17.50% |
FL |
21.80% |
|
NM |
14.40% |
TX |
25.00% |
|
NV |
15.50% |
CA |
18.50% |
|
NY |
21.30% |
FL |
21.50% |
|
OH |
9.10% |
FL |
20.70% |
|
OK |
9.20% |
TX |
24.80% |
|
OR |
13.40% |
WA |
25.90% |
|
PA |
13.20% |
NJ |
16.60% |
|
RI |
20.40% |
MA |
29.10% |
|
SC |
9.20% |
NC |
31.30% |
|
SD |
17.30% |
AZ |
11.90% |
|
TN |
10.50% |
FL |
15.80% |
|
TX |
6.60% |
FL |
10.10% |
|
UT |
11.80% |
ID |
9.40% |
|
VA |
15.70% |
NC |
17.70% |
|
VT |
17.20% |
FL |
19.60% |
|
WA |
13.20% |
OR |
11.40% |
|
WI |
10.60% |
FL |
15.60% |
|
WV |
14.80% |
OH |
17.20% |
|
WY |
19.60% |
CO |
15.80% |
|
States Ranked by Moving |
||
|
State |
Moving |
|
|
1 |
SC |
152 |
|
2 |
FL |
144 |
|
3 |
DE |
138 |
|
4 |
GA |
138 |
|
5 |
NC |
137 |
|
6 |
TN |
126 |
|
7 |
NH |
125 |
|
8 |
NV |
121 |
|
9 |
WV |
121 |
|
10 |
AL |
114 |
|
11 |
KY |
111 |
|
12 |
OH |
110 |
|
13 |
TX |
110 |
|
14 |
AZ |
109 |
|
15 |
AR |
109 |
|
16 |
MS |
108 |
|
17 |
IN |
108 |
|
18 |
ME |
104 |
|
19 |
VA |
104 |
|
20 |
MT |
104 |
|
21 |
OR |
103 |
|
22 |
ID |
103 |
|
23 |
CO |
103 |
|
24 |
VT |
100 |
|
25 |
WY |
100 |
|
26 |
LA |
99 |
|
27 |
PA |
99 |
|
28 |
MO |
98 |
|
29 |
OK |
97 |
|
30 |
NJ |
93 |
|
31 |
NM |
93 |
|
32 |
MD |
93 |
|
33 |
CT |
89 |
|
34 |
KS |
89 |
|
35 |
MI |
88 |
|
36 |
UT |
87 |
|
37 |
NE |
86 |
|
38 |
WA |
86 |
|
39 |
RI |
82 |
|
40 |
IA |
81 |
|
41 |
IL |
79 |
|
42 |
MA |
78 |
|
43 |
WI |
78 |
|
44 |
AK |
76 |
|
45 |
ND |
75 |
|
46 |
NY |
74 |
|
47 |
CA |
72 |
|
48 |
MN |
71 |
|
49 |
HI |
67 |
|
50 |
SD |
64 |
*Moving Popularity Score Index methodology
The popularity score for each state was created by dividing the percentage of all out-of-state purchase mortgage requests for the state by the percentage of the total population each state represents. A score of 100 means a state receives loan requests proportional to its population, above 100 means a state is more popular than its share of the national population and below 100 means a state is less popular than its share of the national population. For example,
About
MEDIA CONTACT:
press@lendingtree.com
![]()
![]() View original content to download multimedia:http://www.prnewswire.com/news-releases/lendingtrees-state-migration-study-finds-americans-are-moving-south-300760617.html
View original content to download multimedia:http://www.prnewswire.com/news-releases/lendingtrees-state-migration-study-finds-americans-are-moving-south-300760617.html
SOURCE